Real-Time Business Dashboard for Performance Monitoring
Business dashboards help companies monitor real-time performance, improve efficiency, and accelerate decisions based on integrated data.
Business dashboard for real-time company performance monitoring
In the era of digital transformation, companies are required to move faster, more accurately, and be more data-driven in their decision-making. Relying on manual reports and traditional spreadsheets is no longer sufficient to meet the dynamic needs of modern business.
This is where the role of a business dashboard becomes crucial. A business dashboard serves as a solution to consolidate various company data sources into a single visual system that is easy to understand, real-time, and can be used for comprehensive performance analysis.
What is a business dashboard?
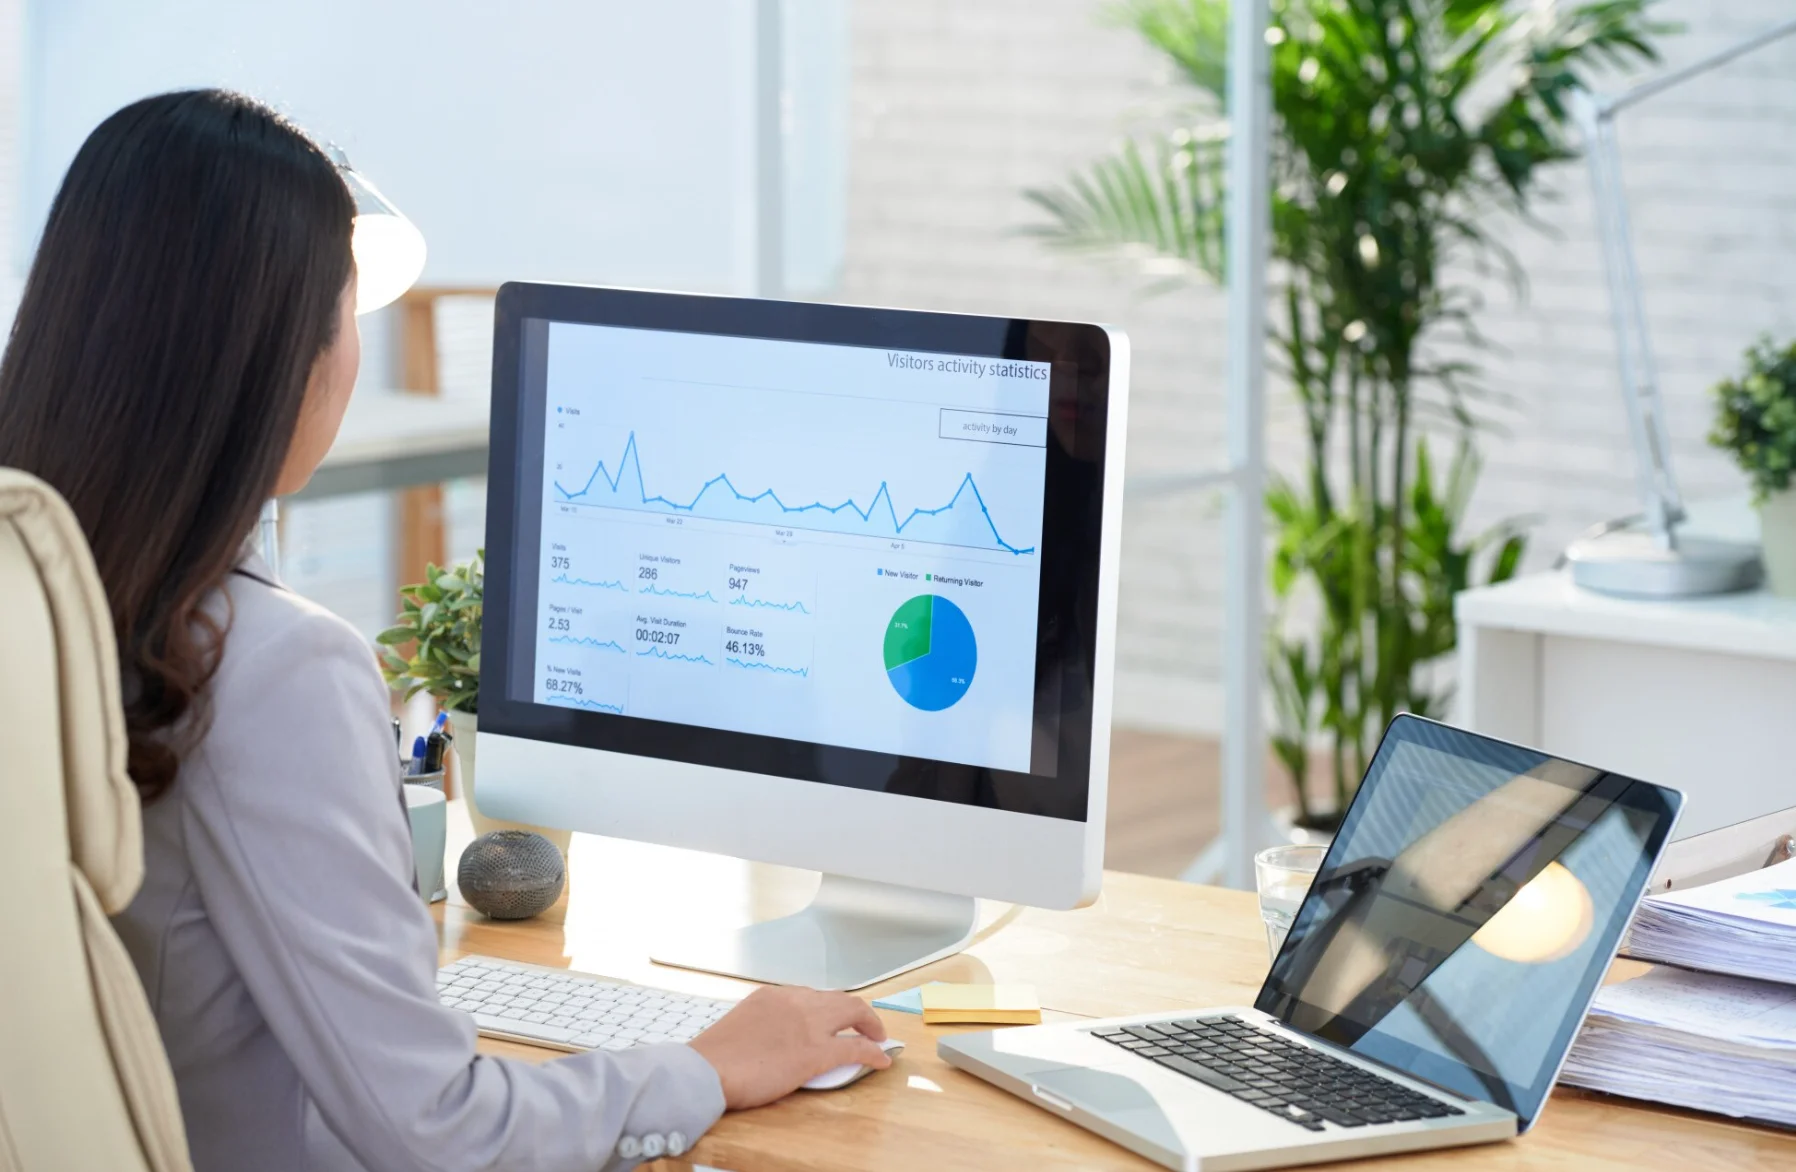
A business dashboard is a data visualization system used to display important company information in the form of graphs, Key Performance Indicators (KPIs), tables, and other metrics in a centralized manner.
This dashboard is typically connected to various internal company systems such as ERP, CRM, sales applications, inventory systems, and other digital platforms.
The main purpose of a business dashboard is to help companies quickly understand operational conditions without having to open multiple systems or wait for manual reports.
Key functions of a business dashboard in a company
A business dashboard not only displays data but also functions as a primary control tool in company operations.
Some of its main functions include:
1. Real-time performance monitoring
All important data such as sales, stock, and team performance can be monitored directly.
2. Simplifying complex data
Large data from various systems is transformed into easily understandable visuals.
3. Supporting decision-making
Management can make decisions based on actual data, not assumptions.
4. Increasing operational efficiency
Reducing manual work in report generation.
5. Providing comprehensive business visibility
All company activities can be viewed in one integrated system.
Important components in a business dashboard
An effective business dashboard typically consists of several key components:
KPI (Key Performance Indicator)
Key indicators used to measure business performance, such as:
Daily revenue
Profit margin
Number of new customers
Conversion rate
Data visualization
Data is presented in the form of graphs, charts, and diagrams for easier analysis.
Real-time data
Information is automatically updated without manual input.
System Integration
A business dashboard connects with various systems such as:
ERP system
CRM system
Inventory system
Business application API integration
Alerts and Notifications
Provides automatic alerts for significant changes in business data.
Business Dashboards within the Company System Ecosystem
In modern companies, a business dashboard is not a standalone system, but rather part of a larger digital ecosystem, such as:
Online ERP
CRM system
Business automation system
Company management system
API integration between applications
With this integration, the business dashboard becomes a central data control hub that connects all company activities on one platform.
Business Dashboards and Business Automation
Technological advancements have elevated business dashboards to a more sophisticated level through business automation.
Modern dashboards not only display data but can also:
Automate operational reports
Send automatic notifications based on certain conditions
Detect data anomalies in real-time
Provide analytics-based insights
For example:
Automatic sales decline detection by the system
Depleting stock immediately triggers alerts to the inventory team
Sales performance monitored without manual reports
This makes business processes faster, more efficient, and minimizes errors.
Business Dashboard Implementation Case Study
A national distribution company faced challenges managing operational data dispersed across various systems. The reporting process took several days, leading to delayed business decisions.
Conditions before implementation:
Sales data not real-time
Manual report generation
Frequent stock discrepancies
Suboptimal sales team monitoring
Solution implemented:
The company implemented an integrated business dashboard connected to:
Sales system
CRM
Cloud ERP
Inventory system
Results after implementation:
Data can be monitored in real-time
Significant reduction in reporting errors
Increased operational efficiency
Faster business decisions
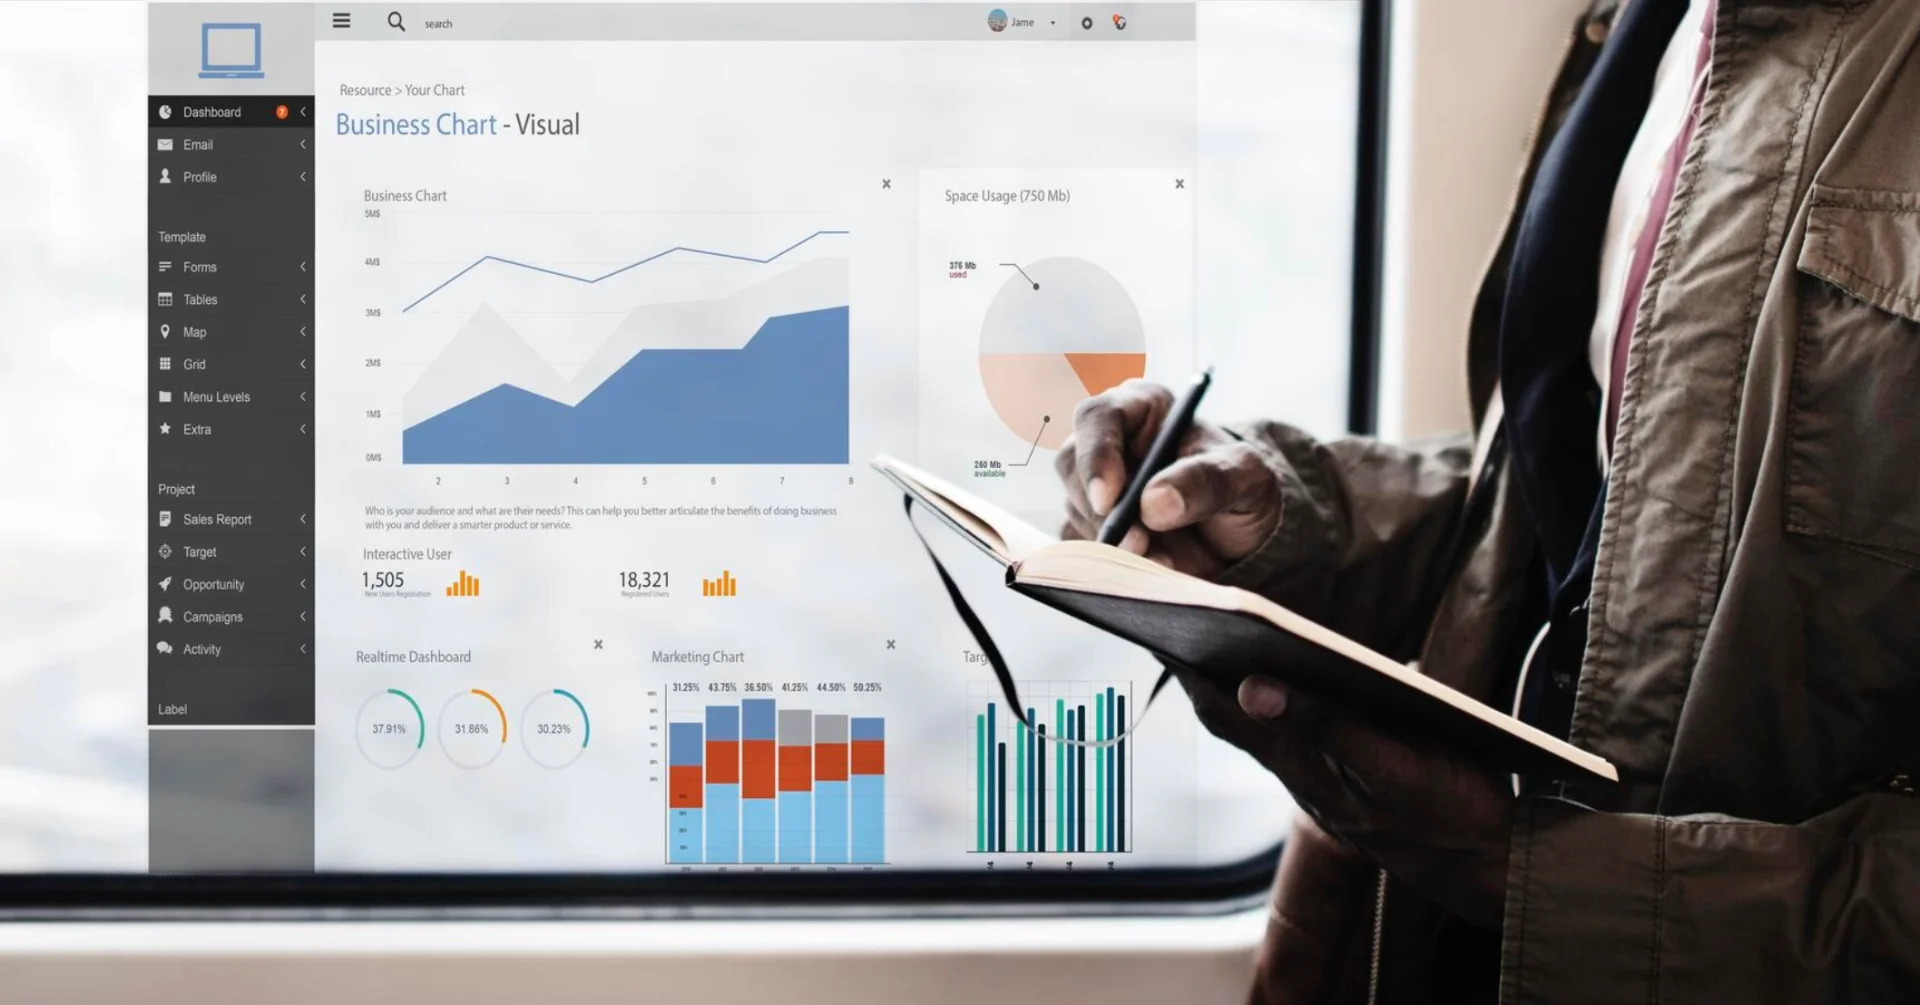
Business dashboards provide full visibility into all company activities.
Business Dashboard Use in Various Industries
Business dashboards can be applied across various industry sectors with different needs.
1. Retail
Daily sales monitoring
Best-selling product analysis
Inventory management
2. Manufacturing
Production process monitoring
Machine downtime analysis
Raw material control
3. Service companies
Project tracking
Team performance evaluation
Revenue per client monitoring
4. Digital startup
User growth tracking
Funnel analysis
Performance marketing
Business Dashboard Integration with Other Systems
For maximum benefit, business dashboards are typically integrated with various systems, such as:
API Integration
Connecting various applications for automatic data synchronization.
ERP system
Combining financial, operational, and production data.
CRM system
Managing customer data centrally.
Inventory system
Controlling product stock in real-time.
AI system
Generating data-driven insights and predictions.
Challenges Without a Business Dashboard
Companies that do not yet use business dashboards often face several challenges:
Data scattered across many platforms
Slow reporting processes
No real-time visibility
Delayed business decisions
High risk of data errors
This makes it difficult for companies to adapt to market changes.
Evolution of Business Dashboards in the AI Era
Business dashboards continue to evolve with the advent of AI and machine learning technologies.
Features that are becoming widely used include:
Predictive analytics
Smart alert system
Automated reporting
Data-driven recommendation system
Dashboards no longer just display data but also help analyze and predict future business conditions.
Types of business dashboards based on company needs
Business dashboards are not always the same in every company. Differences are usually adjusted to the needs of users and the organizational level using them.
At the strategic management level, dashboards are used to view the big picture of the company, such as overall performance, business growth, and general financial conditions. The focus is on data summaries that support long-term decision-making.
At the managerial or departmental level, dashboards are primarily used to monitor team performance and the effectiveness of work processes. The data displayed is usually more detailed than at the strategic level but remains focused on specific areas such as sales, marketing, or operations.
Meanwhile, at the operational level, dashboards are used to monitor daily activities directly. The information displayed is usually real-time, such as transaction status, system activity, or inventory movements.
Important KPIs in modern business dashboards
In business dashboards, KPIs are the main element that determines whether a business is performing well. However, modern KPIs are not limited to just financial aspects.
Financial KPIs typically include revenue, profit margins, and operational cost performance. These indicators are used to assess the overall health of the business from a revenue perspective.
Additionally, there are operational KPIs that focus on work process efficiency, task completion speed, and system and team productivity.
Sales and marketing KPIs are also an important part, especially for assessing the effectiveness of strategies in generating leads and customer conversions.
On the other hand, customer KPIs are used to understand customer loyalty and satisfaction, including retention rates and the likelihood of customers discontinuing service.
The role of real-time data in business dashboards
One of the main advantages of modern business dashboards is their ability to display data in real-time. This means companies no longer have to wait for periodic reports to understand business conditions.
With real-time data, every change in the system can be immediately visible. Sales drops, inventory changes, or increased demand can be detected and acted upon promptly.
This makes the decision-making process faster and more responsive to rapidly changing business conditions.
Differences between traditional and modern business dashboards
Traditional business dashboards typically rely on manual reports generated periodically. Data is often no longer relevant by the time it reaches management due to a time lag in the data collection and reporting process.
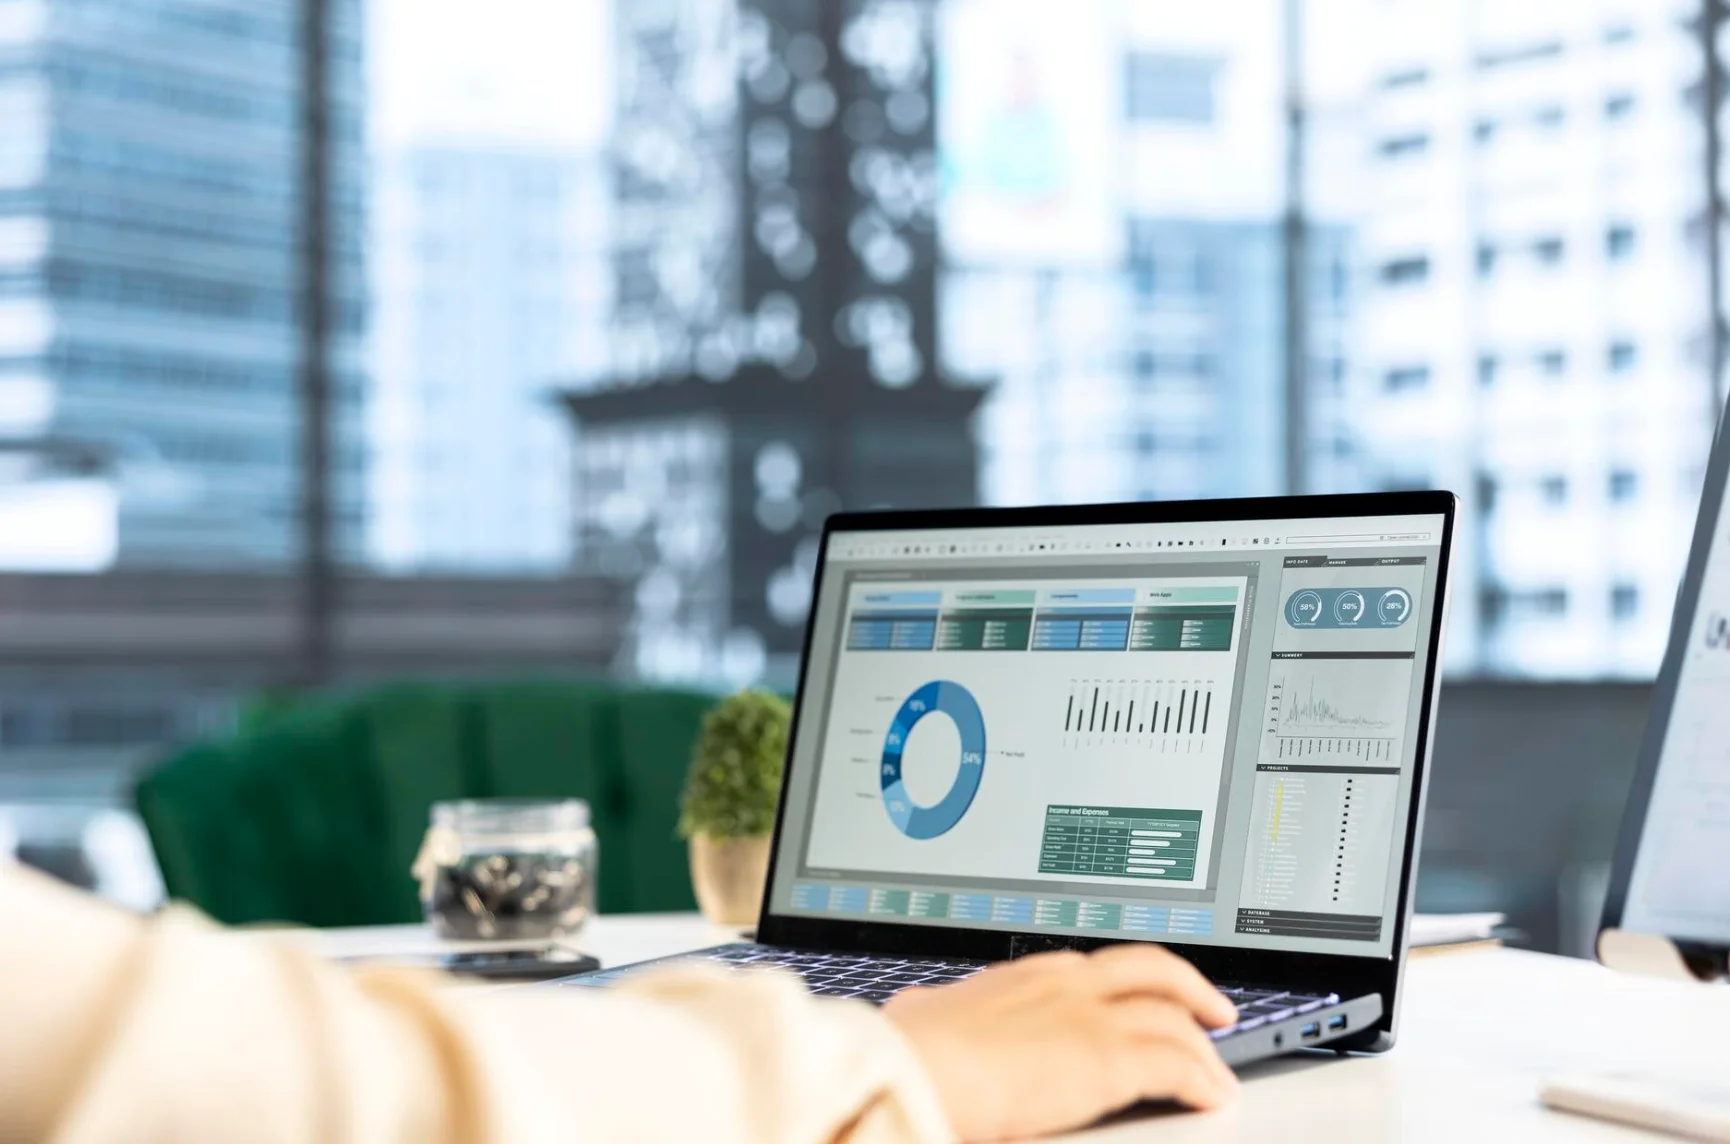
In contrast, modern business dashboards are directly connected to various systems through data integration. Information is updated automatically without the need for manual processes.
Modern dashboards are also more flexible because they can be accessed via various devices and are capable of displaying more interactive data. This makes data analysis easier and faster.
The relationship between business dashboards and data warehouses
In the implementation of more complex enterprise systems, business dashboards typically do not retrieve data directly from operational applications. Data is first collected in a data warehouse.
A data warehouse functions as a central repository for data originating from various different systems. This data is then cleaned, unified, and prepared for analysis.
With a data warehouse, business dashboards can display more consistent, accurate information, ready for decision-making without disrupting primary operational systems.
Common mistakes in business dashboard implementation
Many companies already have business dashboards but do not achieve maximum results due to several implementation mistakes.
One common mistake is displaying too many indicators, making the dashboard difficult to read and not focused on what is important.
Additionally, a lack of integration between systems leads to data inconsistencies, resulting in less accurate analysis.
Another mistake is building a dashboard solely from a visual perspective without considering the business flow and actual user needs. Consequently, the dashboard is not optimally used in daily activities.
Future trends in business dashboards
The future development of business dashboards will increasingly move towards smarter and more automated systems. Integration with artificial intelligence technology will enable dashboards to not only display data but also provide analysis and recommendations automatically.
Dashboard systems will also become more connected to various other business applications within a broader digital ecosystem. This allows companies to have full control over all business processes on a single centralized platform.
With these developments, business dashboards will become an important part of a company's digital transformation focused on efficiency, automation, and data-driven decision-making.

Implementing business dashboards in modern enterprise systems
The application of business dashboards depends not only on data visualization but also on how the system is designed and integrated with the company's digital infrastructure.
In many cases, business dashboards need to connect with various systems such as ERP, CRM, internal applications, and even external APIs so that data can flow automatically and in real-time.
This process typically includes:
Business needs analysis
Data structure design
System integration (API integration)
Custom dashboard development
Performance optimization and data security
At this stage, companies usually require a more technical and structured system development approach, as each business has different workflows and data requirements.
BMS Services focuses on developing custom business systems, including integrated business dashboards, ERP, CRM, and business process automation solutions tailored to the company's operational needs.
Conclusion
Business dashboards are a critical component in modern, data-driven company management systems that prioritize decision-making speed. With real-time monitoring capabilities, companies can gain a comprehensive understanding of operational conditions without waiting for manual reports.
Through integration with systems like ERP, CRM, and various other operational applications, business dashboards help consolidate previously scattered data into a more structured and easily analyzable view.
Furthermore, business dashboards also enhance work efficiency because reporting processes become automated, reducing the potential for human error and accelerating access to critical information.
In practice, implementing an integrated business dashboard requires the right system development approach to align with the company's workflow. Such solutions are typically developed through custom systems capable of adapting to the specific needs of each business, including cross-platform data integration and operational process automation.
Real-world examples of real-time dashboards across industries
Every industry tracks different key metrics. Here are concrete examples of how a real-time business dashboard is used in daily operations.
Retail: monitoring sales and stock across branches
A retail chain with several branches uses a dashboard to track sales per store per hour, best-selling products, and stock that is running low. When a popular product is nearly out of stock at one branch, the team can arrange a stock transfer or restock immediately instead of waiting for end-of-day reports.
Manufacturing: watching the production line live
A manufacturing plant monitors production output per shift, reject rates, and machine downtime on a single screen. When a machine shows falling output or a rising reject rate, the supervisor can act within minutes instead of waiting for the weekly report.
Distribution and logistics: tracking deliveries in real time
A distribution company uses a dashboard to track delivery status, on-time delivery rates, and fleet utilization live, so delays can be handled before customers complain.
The impact on decision-making speed
Across all three examples, the same pattern appears: the time between an event and a decision shrinks from days to minutes. That is the core value of a real-time dashboard, decisions based on actual data taken while problems can still be fixed.